Dashboard / 2024
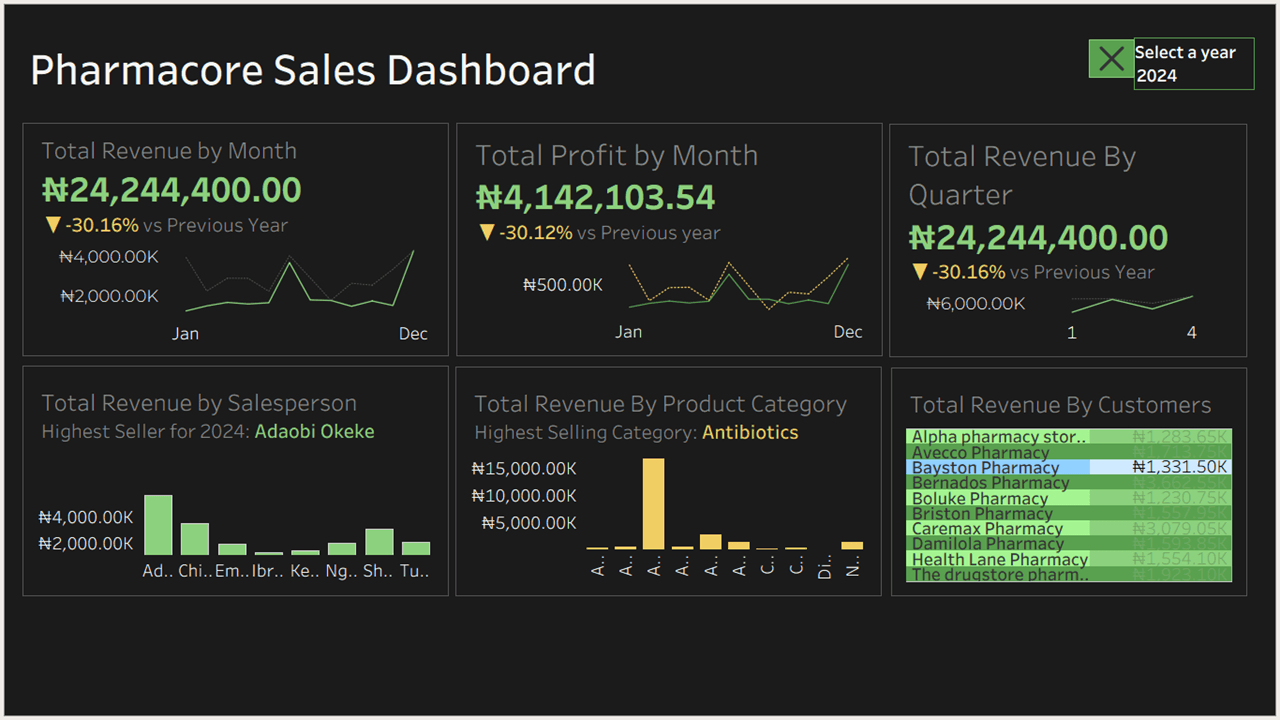
Pharmacy Distribution Visualizaton in Tableau.
Business Scenario
PharmaCore Distribution is a wholesale pharmaceutical distributor supplying independent and chain pharmacies across four regions of Nigeria (North, South, East, and West). The company's field sales team manages relationships with registered pharmacy customers, who place orders for prescription and over-the-counter medicines that are fulfilled through third-party logistics partners and paid for via card, check, or cash.
A Sales Dashboard was built from PharmaCore's raw order-level data to track monthly revenue, profit, and top performers at a glance. This companion report was developed alongside it, going a level deeper into the same data to surface trends, concentration, and risk that the dashboard's summary view couldn't capture on its own and to set out what the business should prioritize going into the next planning cycle.
Business Questions
How does revenue move through the year, and what does the seasonal patterns say?
Which product categories carry the business, and how concentrated is that reliance?
How dependent is PharmaCore on its largest customers?
What is most likely behind the year-over-year revenue decline, and what should PharmaCore watch?
Findings
How does revenue move through the year, and what does the seasonal patterns say?
Revenue is highly seasonal rather than flat. Two clear peaks stand out ( June and December) each running roughly 50–85% above the monthly average, while February and April are the softest months of the year. Q4 is the strongest quarter, contributing over a third of annual revenue, nearly double Q1's share. This lines up with the dip-then-climb shape on the dashboard's "Total Revenue by Month" and "Total Revenue by Quarter" panels.
Which product categories carry the business, and how concentrated is that reliance?
Antibiotics are confirmed as the dashboard's highest-selling category and the underlying data shows just how dominant that lead is: antibiotics account for roughly 63% of total product revenue, more than every other category combined. Antidiarrheals are a distant second at around 16%, with NSAIDs, antihypertensives, cough syrups, and analgesics each in the 4–6% range.
A second pattern worth flagging: revenue and volume are not exactly correlative. The single highest-volume product (units sold) is not the top revenue earner. A small set of higher-priced antibiotic and antidiarrheal lines generate outsized revenue from comparatively fewer units. This points to a small group of SKUs the business is quietly dependent on.
Takeaway: a category this concentrated is efficient, but it is also a single point of failure because a supply disruption, price change, or competitor move in antibiotics would hit revenue disproportionately.
How dependent is PharmaCore on its largest customers?
Of the 15 pharmacy accounts in the book, the top 10 customers generate roughly 86% of total revenue, and the top 3 alone (Bernados Pharmacy, Caremax Pharmacy, and Nett Pharmacy) contribute close to a third of it. This mirrors the concentration visible in the dashboard's "Total Revenue by Customers" ranking, but the underlying data shows just how thin the base really is beneath the top names.
Takeaway: losing even one or two of these accounts would materially move total revenue. Account retention and diversification into the long tail of smaller pharmacies should be a standing priority.
What is most likely behind the year-over-year revenue decline, and what should PharmaCore watch?
The dashboard flags a -30.16% revenue decline and a -30.12% profit decline against the prior year nearly identical drops, which suggests margins held up and the story is a volume/demand issue, not a pricing or cost problem. Three patterns in the underlying data point to likely contributors: heavy reliance on a handful of customers and a single dominant product category (either of which can swing total revenue sharply if demand softens even slightly), plus the seasonal concentration in June and December meaning any disruption to those two windows would show up immediately in annual totals.
Summary of Recommendations
Build inventory and staffing plans around the June and December demand peaks instead of a flat monthly average.
Actively grow revenue outside antibiotics to reduce single-category exposure even a few points of share shifted to NSAIDs, analgesics, or antihypertensives would meaningfully de-risk the portfolio.
Protect and deepen relationships with the top 10 accounts, while running a deliberate push to convert more of the long tail of smaller pharmacies into repeat customers.
Invest a small, targeted effort in the West and South regions, where the gap to close is smallest.
Similar projects
See all →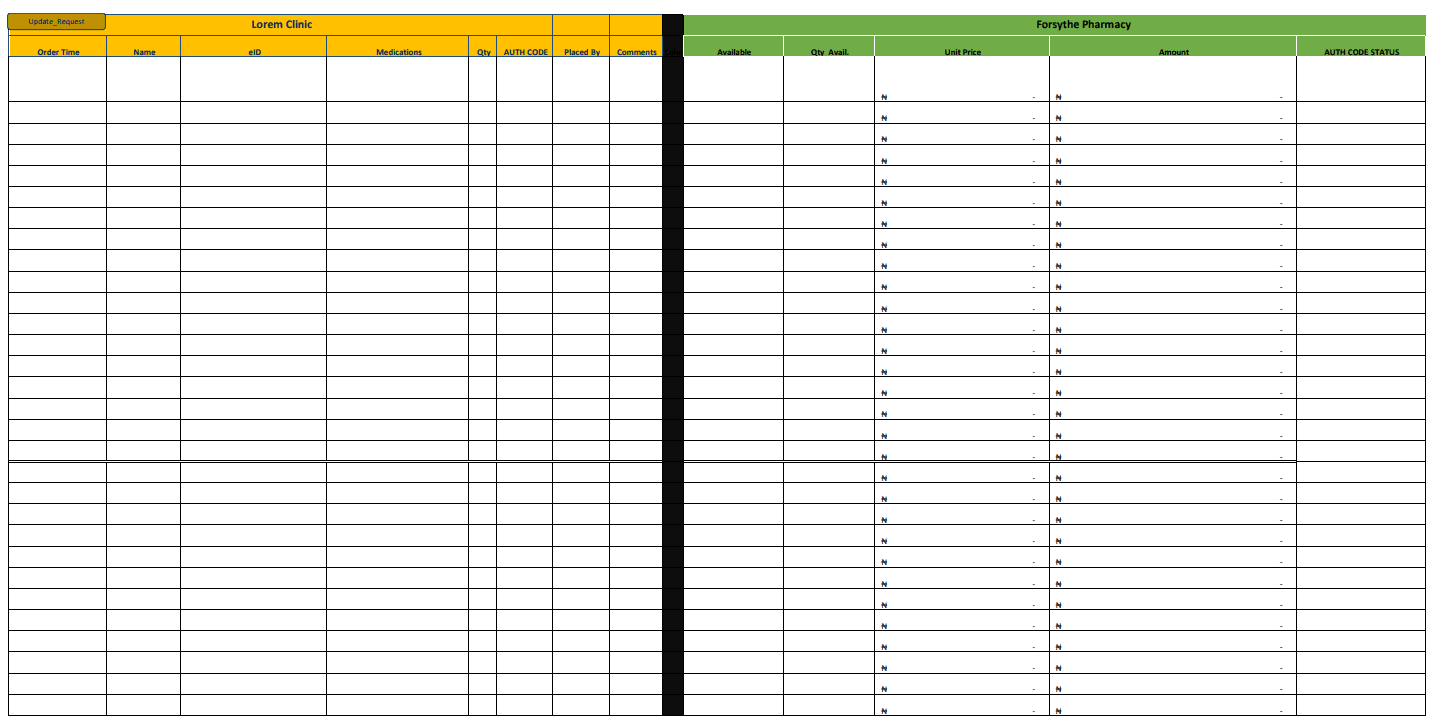
Building a Row-by-Row Order Tracker: A Spreadsheet That Behaves Like a Mini-App
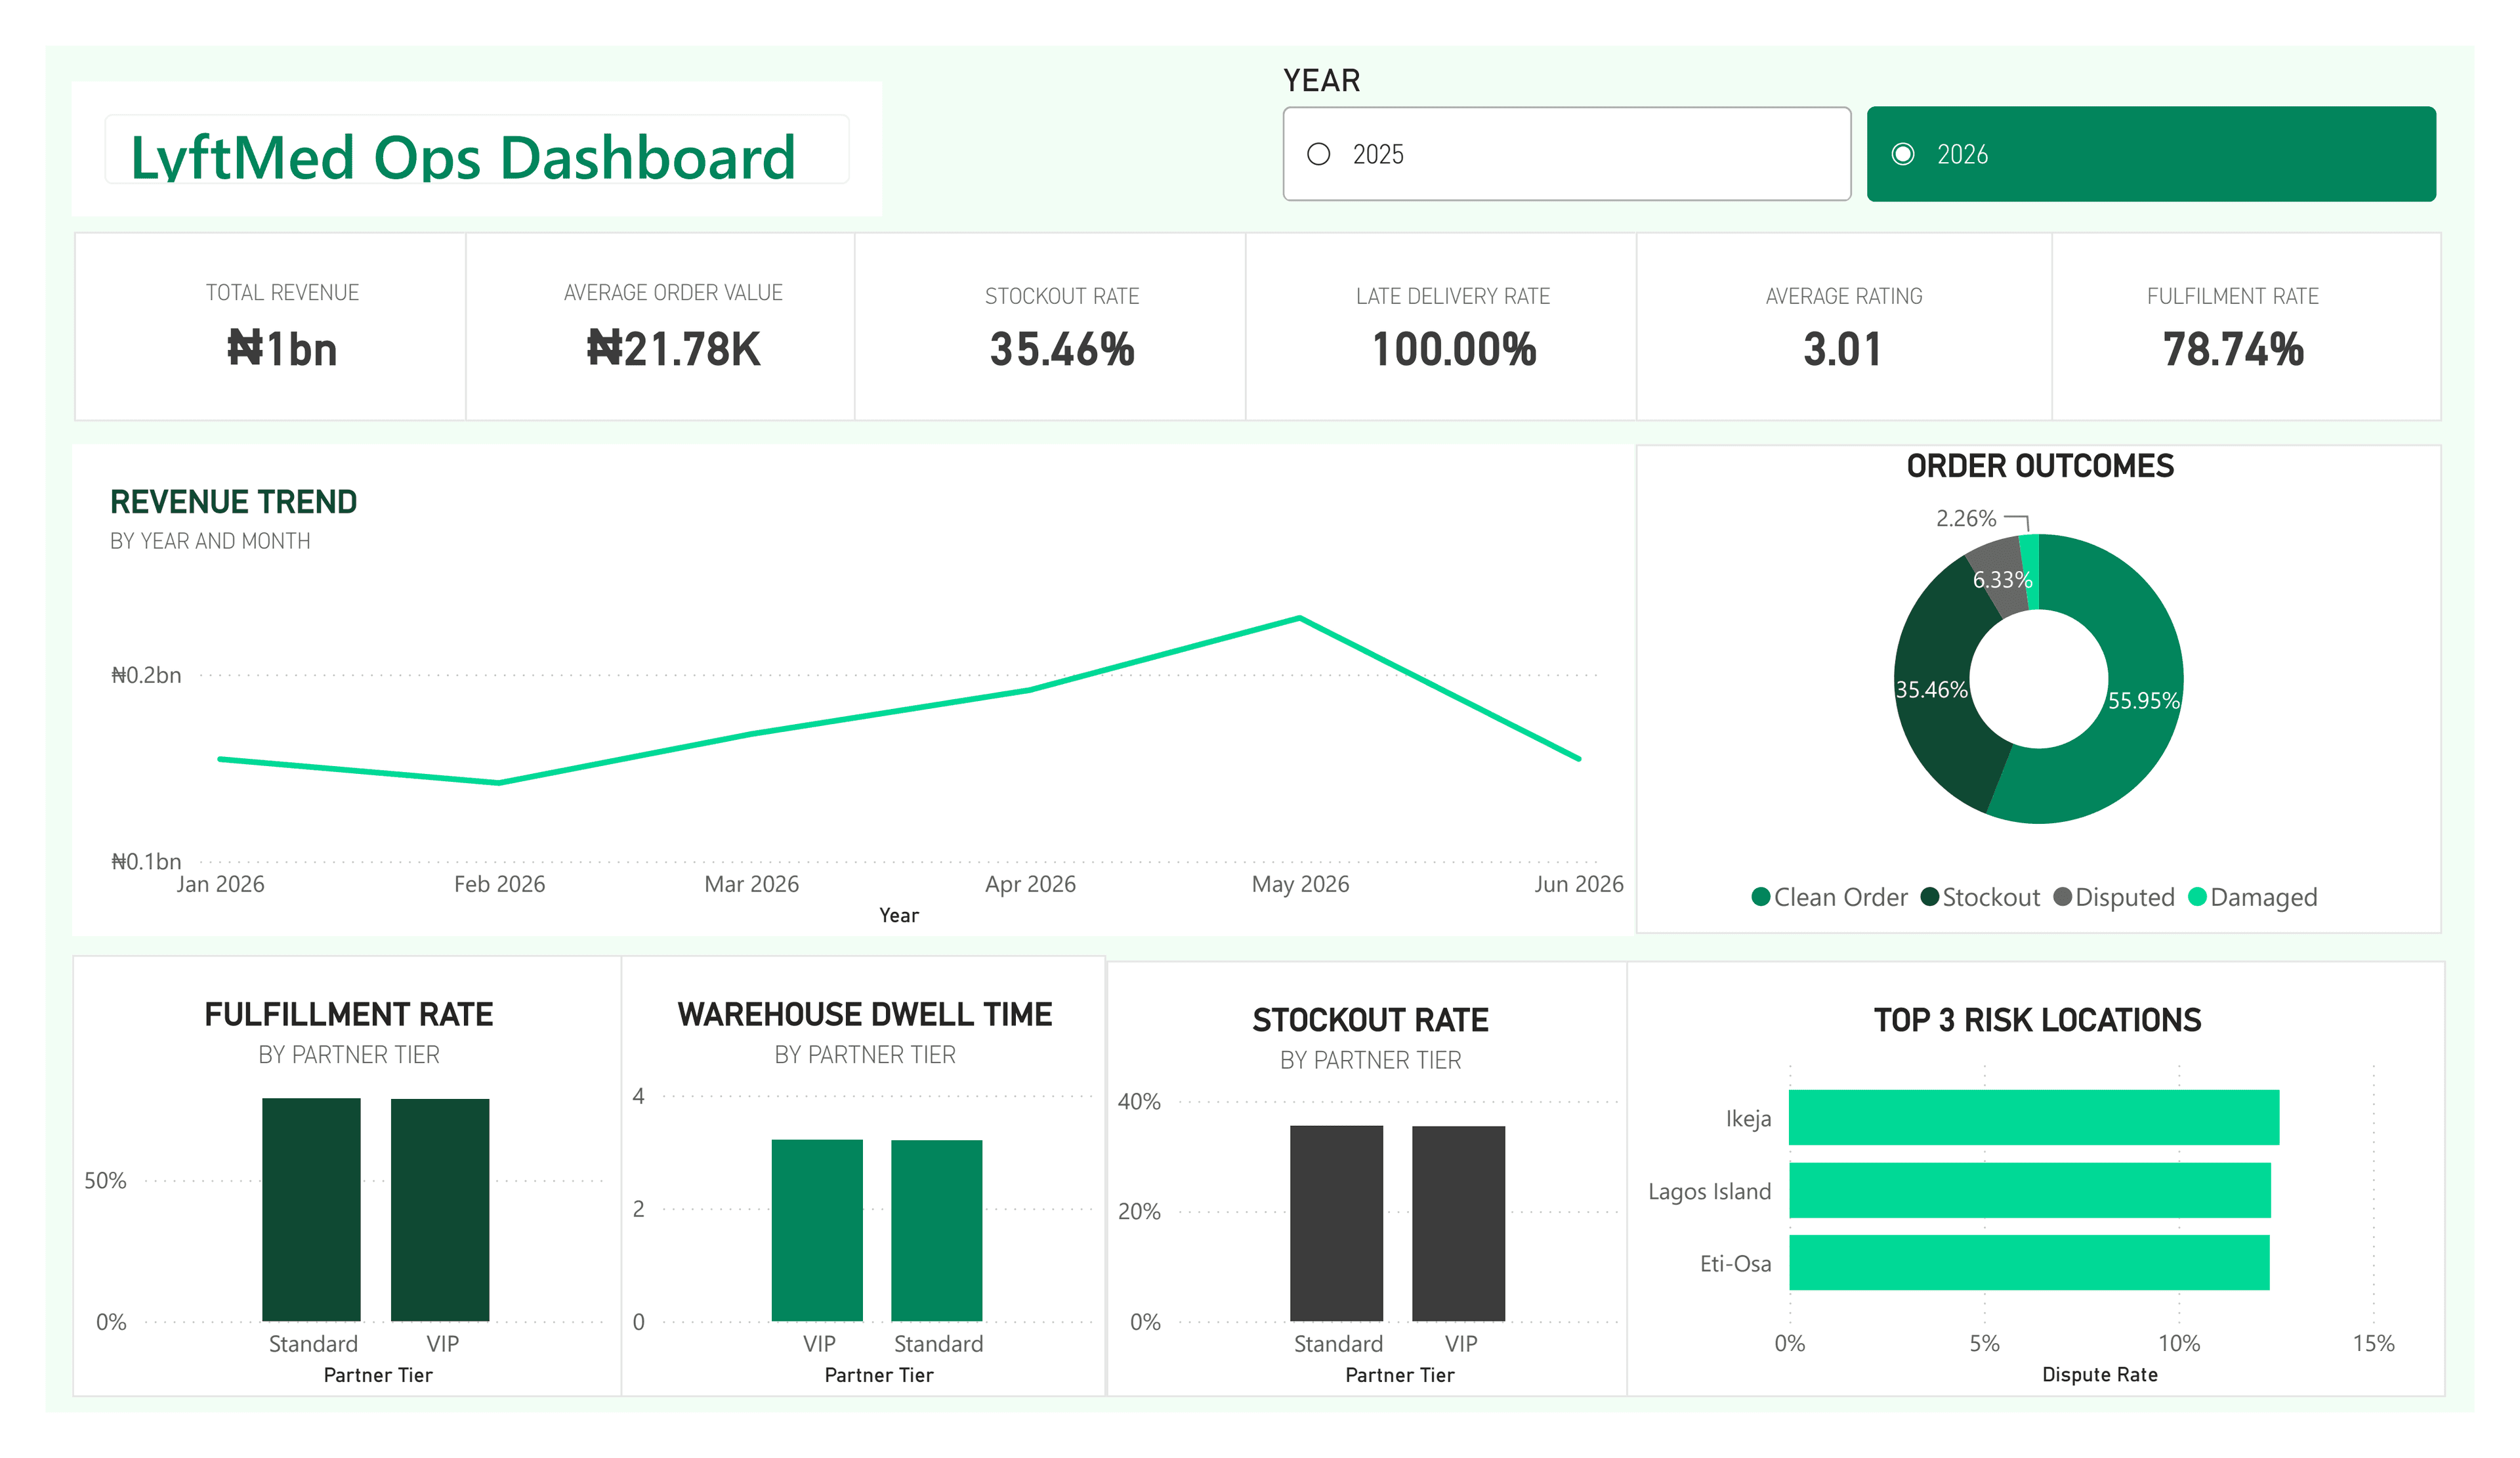
LyftMed Opeations Analysis I: Data Cleaning
Have a data story to shape?
Let's collaborate on a clear analytical product.
Get in touch